Kelvin
Develop a KPI dashboard to analyze the sentiment of agile teams based on aspects.
- Business problem: How do we measure how teams / organizations feel across the multiple stages of a certain project?
- Technical question: How do we perform aspect-based sentiment analysis over conversational data?
Requirements
Basic functional requirements:
- Visualization of Sentiment Analysis Dashboard
- Fine-tuning and deployment of ML Model as microservice
- Integrating the data of communication tools
Basic non-functional requirements:
- Easy to use user interface
- Appropriate deployment strategy
Aspect-based Sentiment Analysis
ABSA is text analysis technique that categorizes data by aspect and identifies the sentiment attributed to each one of them.
- aspect: category, feature, or topic that is being talked about (can be any Part-of-Speech) sentiment
- score**: a value between 0 and 1 which resembles the confidence of a certain text corpus expressing neutral, negative, or positive "opinions" about a particular aspect
NLP - "behind the scenes": Aspect Extraction
- In order for a sequence s of n words to bed into the BERT architecture, they are represented as [CLS], w1, w2, …, wn, [SEP] where:
- [CLS] is the token indicating of the beginning of the sequence
- [SEP] is the token to separate a sequence from the subsequent one
- wi are the words of the sequence
- Goal: Each word of the input is labeled as one of the three letters:
- B: beginning of the aspect terms,
- I: inside or the aspect terms' continuation
- O: outside or the non-aspect terms
- Input => BERT model => vector representation of the size 768 for each sequence => word-to-label mapping
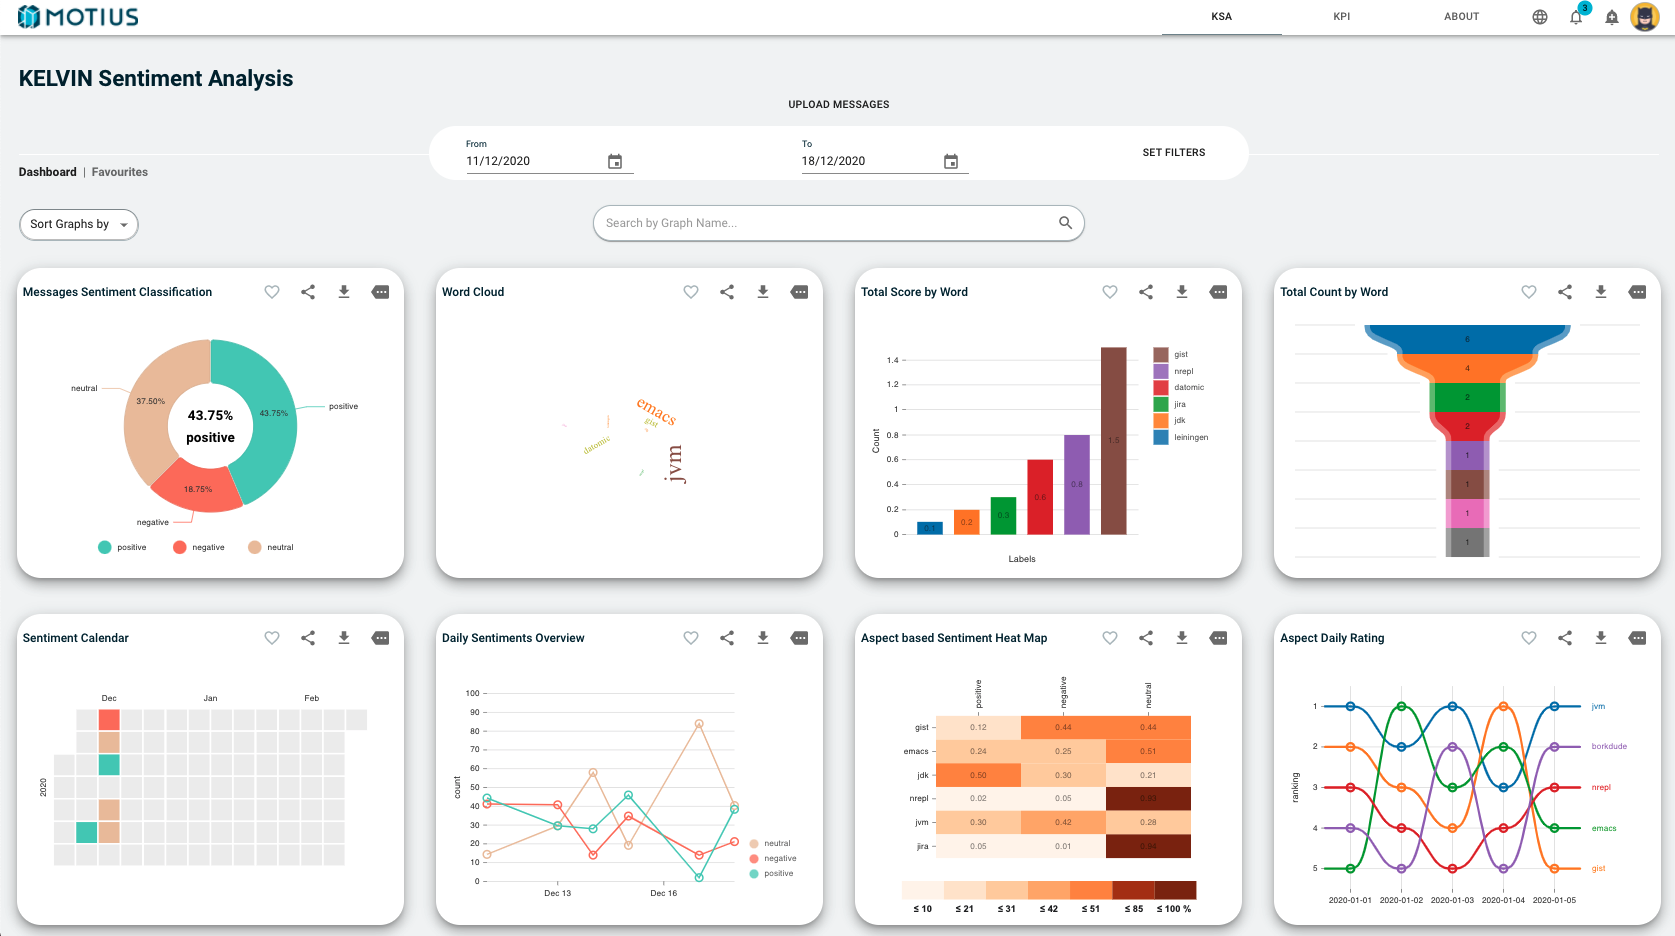
Visualizations
Messages Sentiment Classification
- Bucketing all filtered messages in 3 ways (+,-,neu).
- In case that 1 message has more than 1 aspect that message is duplicated and processed twice.
- The leading sentiment (the sentiment with the highest %) iis used to place the message in the right bucket.
- Pie slice % = bucket.length / (3 buckets).length
Daily Sentiment Overview / Calendar
- We group all filtered messages by day and calculate the total +,-,neu sentiment from each message and aspect of that day.
- We then calculate the avg (+,-,neu) = total (+,-,neu) / counter
- We use these individual +,-,neu value to build the daily sentiment graph.
- We only use the leading sentiment (highest avg score) to build the sentiment calendar.
Aspect Based Heat Map
- Construct a flat array of all aspects found in filtered messages.
- Use this flat array to group messages by the specific aspects.
- For each aspect group we calculate: avg (+,-,neu) per aspect = total (+,-,neu) / counter
- We use the acquired values to construct the heat map.
- Strongest Color = highest score
- Weakest Color = lowest score
Total Count by Word / Word Cloud
- We create a map of all aspects included in the filtered messages.
- We then analyze the filtered messages and calculate the total count for each aspect.
- This mapping of (aspect : total_count) is used in both graphs:
- Total Count by Word (Aspect)
- Word (Aspect) Cloud
Total Score by Word
- The same map of ( aspect : total_count ) is used in combination with weights.
- These weights are proposed from the user.
- A higher weight dictates a greater interest on the aspect.
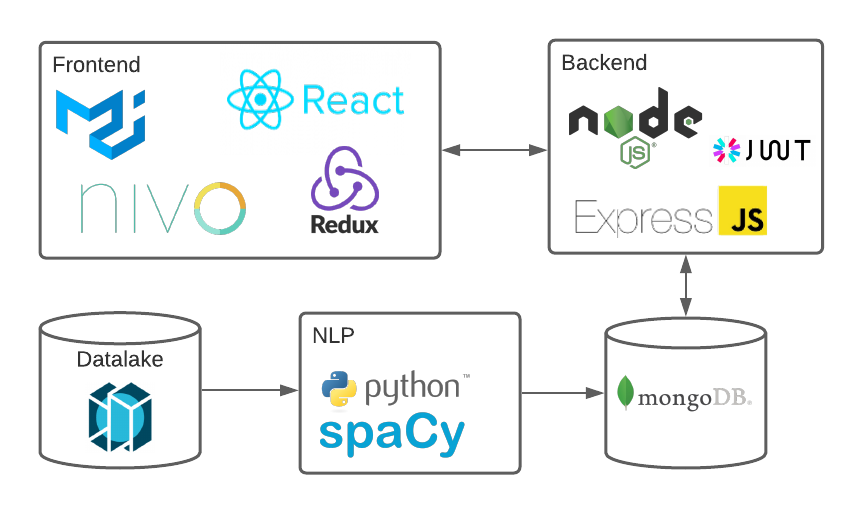
Tech Stack
Frontend:
React
Material UI
Redux
Nivo Charts
Backend:
Express.js
Flask
Mongoose.js
JWT
Infrastructure:
MongoDB
GitLab CI/CD
Rancher Labs
Tools & Packages:
NumPy
ABSA NLP
Pandas
Jest
Last updated on